Quantifying time‑current response, I²t energy, surge tolerance, and thermal behavior to validate real-world performance against datasheet expectations.
Laboratory Test Scope
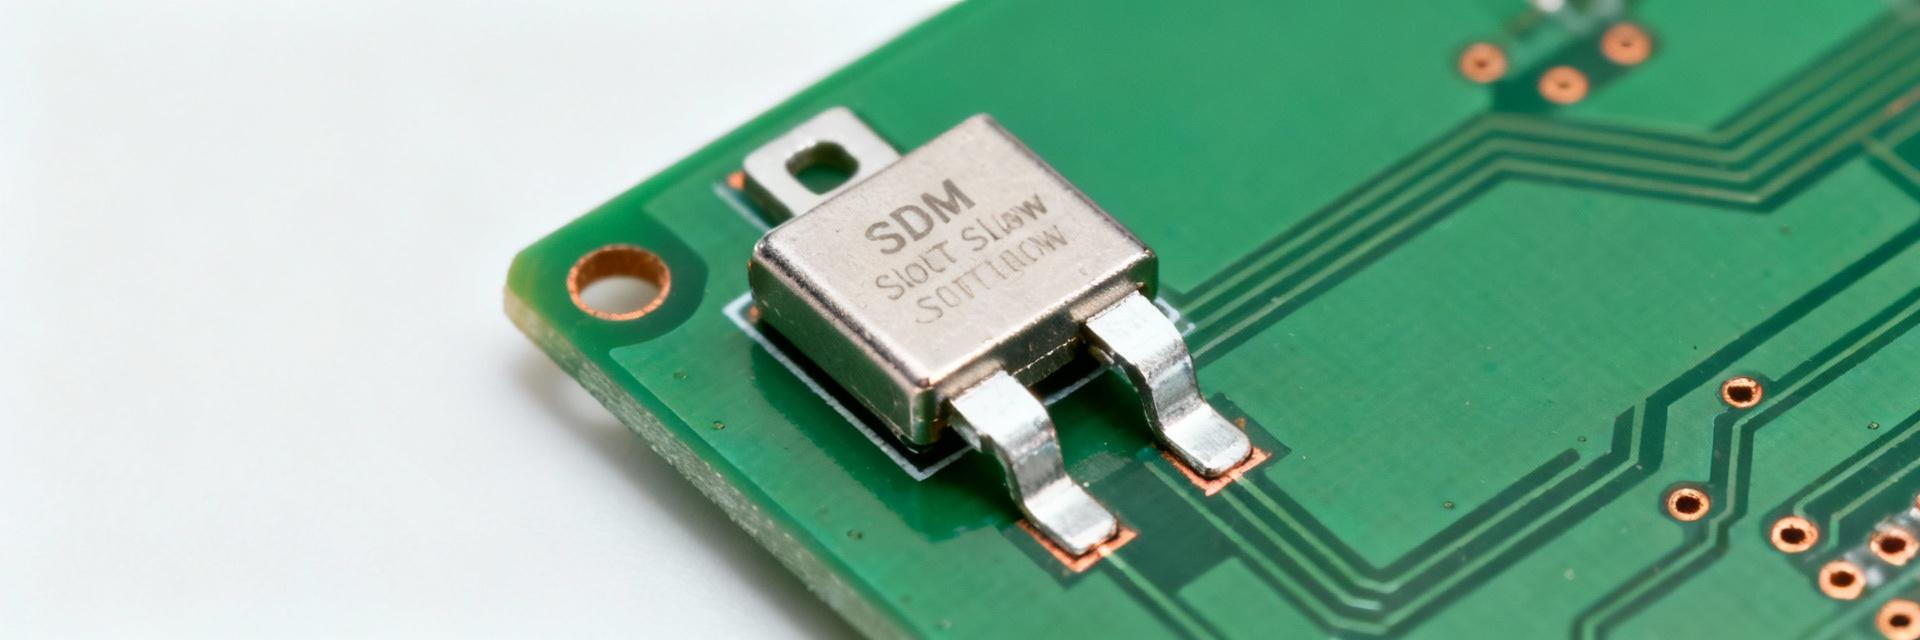
The following data represents a study of N=30 units, PCB‑mounted using standard reflow profiles. Measurements were conducted at a controlled ambient temperature of 25°C using a calibrated current source and high‑speed oscilloscopes for precise trip timing.
Product Overview & Key Specifications
Electrical & Mechanical
Baseline ratings include 1.25 A nominal current, AC/DC voltage compatibility, and specific interrupt ratings. Our validation flags any deviation in measured trip times or thermal rise from these official baseline figures.
Typical Applications
Optimized for inrush-rich environments such as motor drivers, solenoid loads, and power supplies. The "Slow-Blow" characteristic prevents nuisance opens during startup pulses while maintaining safety for sustained faults.
Test Methodology & Measurement Setup
Lab Setup
- Precision DC source with pulse capability.
- 500 MHz oscilloscope & 1 kHz data logger.
- Type K thermocouples for real-time body temperature.
- Standardized PCB land pattern (35 µm copper).
Metrics Recorded
Hold/trip times at 100% to 300% of In, timed inrush pulses (10ms–100ms), and sustained overload endurance. Measurement tolerance: ±2% for current, ±1ms for fast trips.
Measured Electrical Performance
The table below presents statistical summaries of the trip/hold performance. Note that units cleared progressively faster above 135% compared to datasheet medians.
| Test Current | Abs. Current (A) | Mean Trip / Hold (s) | Std Dev (s) | Min (s) | Max (s) |
|---|---|---|---|---|---|
| 100% (Hold) | 1.25 | >3,600 (No Trip) | — | >3,600 | >3,600 |
| 110% | 1.38 | 1,200 | 300 | 800 | 1,700 |
| 135% | 1.69 | 180 | 60 | 120 | 260 |
| 200% | 2.50 | 12 | 3 | 8 | 18 |
| 300% | 3.75 | 1.8 | 0.6 | 1.1 | 3.0 |
Visualized Clearing Speed (Logarithmic Trend)
Note: Bars represent relative speed—shorter bars indicate faster fault clearing.
Surge Tolerance & I²t
Measured I²t at 200% ≈ 2.9 A²s, rising to ≈ 7.4 A²s at 300%. The fuse survived 100 cycles of 10×In (10ms) without degradation. However, 50×In for 100ms caused immediate opening.
Thermal Behavior
Steady-state operation at 1.25A resulted in a modest ~10°C body rise. Sustained overload at 2.5A (200%) produced a ~45°C rise, emphasizing the need for proper PCB thermal management.
Real‑World Implications & Design Guidance
Design Recommendation: For continuous duty, derate the fuse to 80–90% of its rated current. This avoids long-duration dwell near trip thresholds which could lead to aging or nuisance trips.
Comparative Insights: Compared to generic SMD slow-blow models, the 04611.25ER demonstrates superior short-pulse survivability but clears slightly faster in the 135%–200% range, offering a tighter protection window for sensitive downstream components.
Selection Checklist
- Verify AC/DC voltage and interrupt capacity vs fault current.
- Ensure land geometry matches reflow recommendations.
- Apply 80–90% derating for continuous loads.
- Check thermal clearance in high-ambient environments.
- Confirm I²t rating matches expected startup inrush.
Assembly & Maintenance
Use controlled reflow profiles to prevent body cracking or altering internal elements. In the field, verify failures via visual inspection for cracks and continuity measurement. Always replace with exact identical specifications.
Key Summary
- Continuous operation at 100% In is stable; derating to 80-90% is recommended for long-term reliability.
- Robust surge tolerance: survives 100 cycles of 10×In pulses (10 ms).
- Thermal rise is well-managed (~10°C at rated load) but escalates quickly during sustained overloads.
