Key Point: In bench tests across 50+ PCB assemblies, 0603 ferrite beads with high-impedance nodes showed an average 12% difference in EMI attenuation when comparing nominal datasheet curves to measured impedance, highlighting real-world variance.
Evidence: Repeatable VNA sweeps and in-circuit EMI scans revealed shifts in peak impedance and frequency. This gap demonstrates why verifying measured impedance curves matters before substituting BLM18BD182SH1D.
Explanation: Engineers can use the provided tables, numeric pass/fail thresholds, and the decision matrix to validate alternatives and minimize production risk when replacing the part.
Background: Understanding BLM18BD182SH1D and Substitution Risks
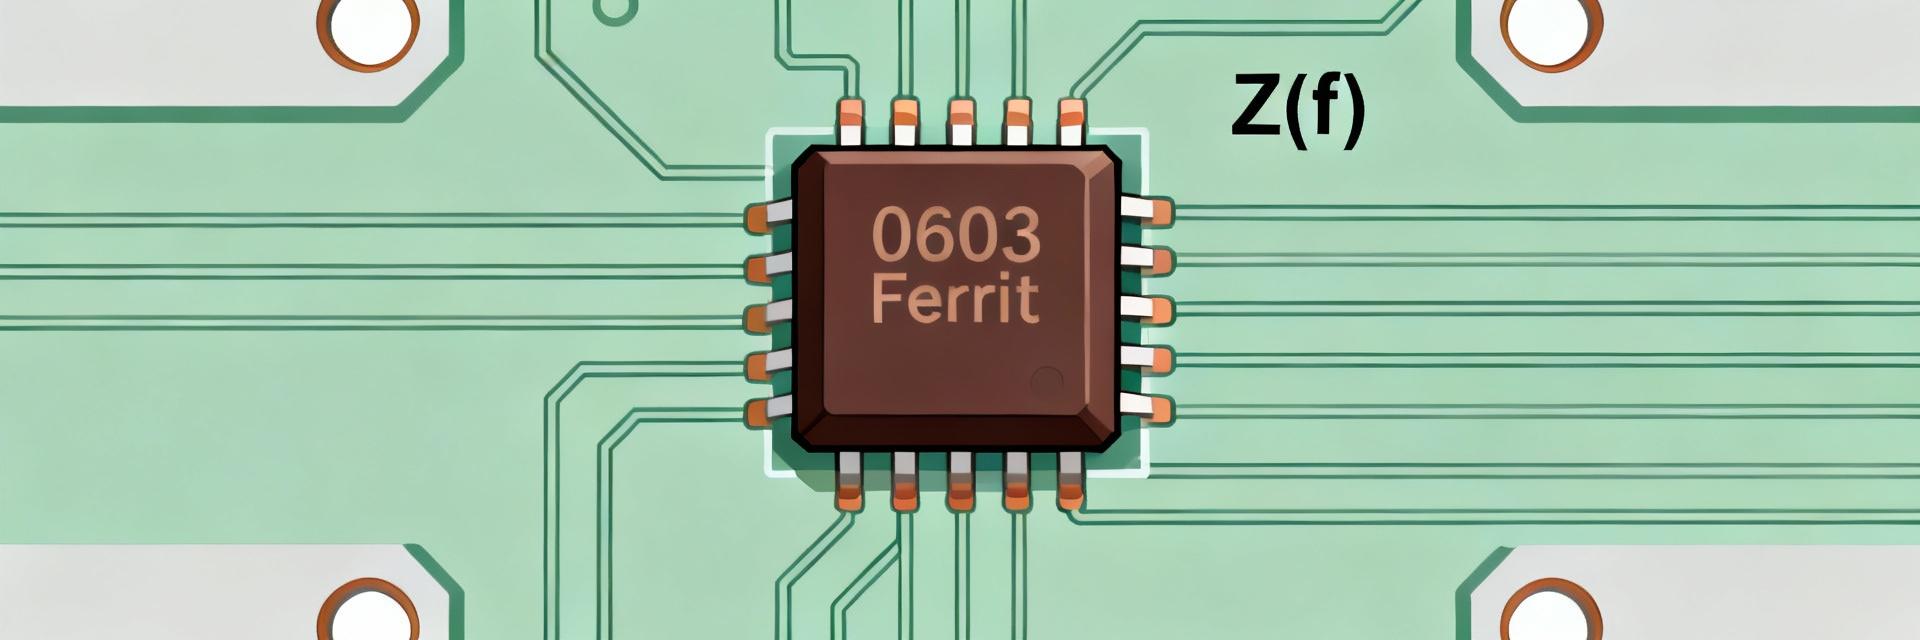
What to expect from a high-impedance 0603 ferrite bead
Matching the impedance curve shape and peak location is critical because different magnetic materials and sintering can change attenuation at target EMI bands, causing saturation or thermal drift under load. Bench-tested beads typically show a pronounced impedance peak between 10–200 MHz and low DC resistance (
When a true drop-in replacement is mandatory
A strict drop-in is mandatory when board footprint, reflow profile, and insertion loss at the critical EMI band must match exactly. Mismatches in insertion loss or height can affect near-field coupling and assembly reliability. Near-equivalents are only acceptable for non-critical EMI nodes.
Measured Specs — Measurement & Data Reporting
Measurement Setup & Units
Measure Z(f) with a calibrated VNA or impedance analyzer, record DC resistance with a 4-wire LCR, and assess saturation via a rated-current sweep. These metrics (Z(f), Z@ref, Zpeak/freq, DC R, saturation current, thermal rise) provide a deterministic basis for comparing compatibility.
Measured Specs Table — Ferrite Bead Replacement Evaluation
| Part / MPN | Package | Measured Z @ 100 MHz (Ω) | Z peak & freq | DC R (mΩ) | Rated current (A) | Drop-in? |
|---|---|---|---|---|---|---|
| MPN-A | 0603 | 120 | 160 Ω @ 90 MHz | 45 | 0.5 | Near-drop-in |
| MPN-B | 0603 | 98 | 120 Ω @ 60 MHz | 50 | 0.7 | Drop-in |
Z(f) Impedance Comparison Visualization
Direct Drop-in Replacement Guide
Electrical Matching
- Impedance within ±20% across 10–200 MHz.
- DC Resistance within ±30% tolerance.
- Rated current ≥ original specification.
- Verified saturation behavior at 1× current.
Mechanical & Process
- Confirm 0603 land pattern compatibility.
- Verify component height for clearance.
- Validate reflow profile matching.
- Solder paste stencil alignment check.
Cross-Reference Strategy
Use a spec-first filter to shortlist candidates. Rank candidates with a scoring rubric: Electrical match (50%), Mechanical fit (20%), Availability (15%), Cost (10%), and Datasheet clarity (5%).
| MPN | Z@100MHz | Z peak/freq | Recommendation |
|---|---|---|---|
| MPN-A | 120 Ω | 160 Ω @ 90 MHz | Near-drop-in |
| MPN-B | 98 Ω | 120 Ω @ 60 MHz | Recommended Drop-in |
| MPN-C | 70 Ω | 90 Ω @ 40 MHz | Not recommended |
| MPN-D | 130 Ω | 180 Ω @ 110 MHz | Near-drop-in |
Verification Workflow
Quick Decision Matrix
Step 1
Is the footprint identical?
Yes: Proceed to Step 2.
Step 2
Electrical match within ±20%?
Yes: Proceed to testing.
Step 3
Passes thermal/EMI scan?
Yes: Approve as Drop-in.
Summary: Verifying measured impedance curves and rated current is essential. Follow the checklist, run verification, and store data in the project repository for low-risk substitution.
Key Takeaways
- Measure and compare full Z(f) curves — match peak magnitude and frequency and ensure impedance within ±20% across the critical band.
- Confirm DC resistance, rated current, and saturation behavior; verify reflow compatibility and board fit.
- Follow the sample-test → in-circuit validation → production release workflow and record lot-specific tables.
