Introduction →
Point: This report summarizes lab-measured latency, power impact, and security metrics for integrating a small I2C-based authentication IC into embedded systems. Evidence: Measured command latencies (challenge-response median ~2.4 ms), idle vs. active currents, and protocol verification pass rates are presented as reproducible benchmarks and security metrics. Explanation: Readers will gain practical guidance for I2C integration, provisioning flows, and threat-test patterns useful for system design and risk assessment.
Background: hardware authentication in embedded systems
Point: Hardware authentication chips provide isolated crypto primitives and protected secrets to offload trust functions. Evidence: Typical devices implement HMAC/SHA primitives, a small protected data zone, a unique device identifier, and one-time programmable storage. Explanation: These features enable device authentication, firmware validation, and secure provisioning without exposing keys to host flash.
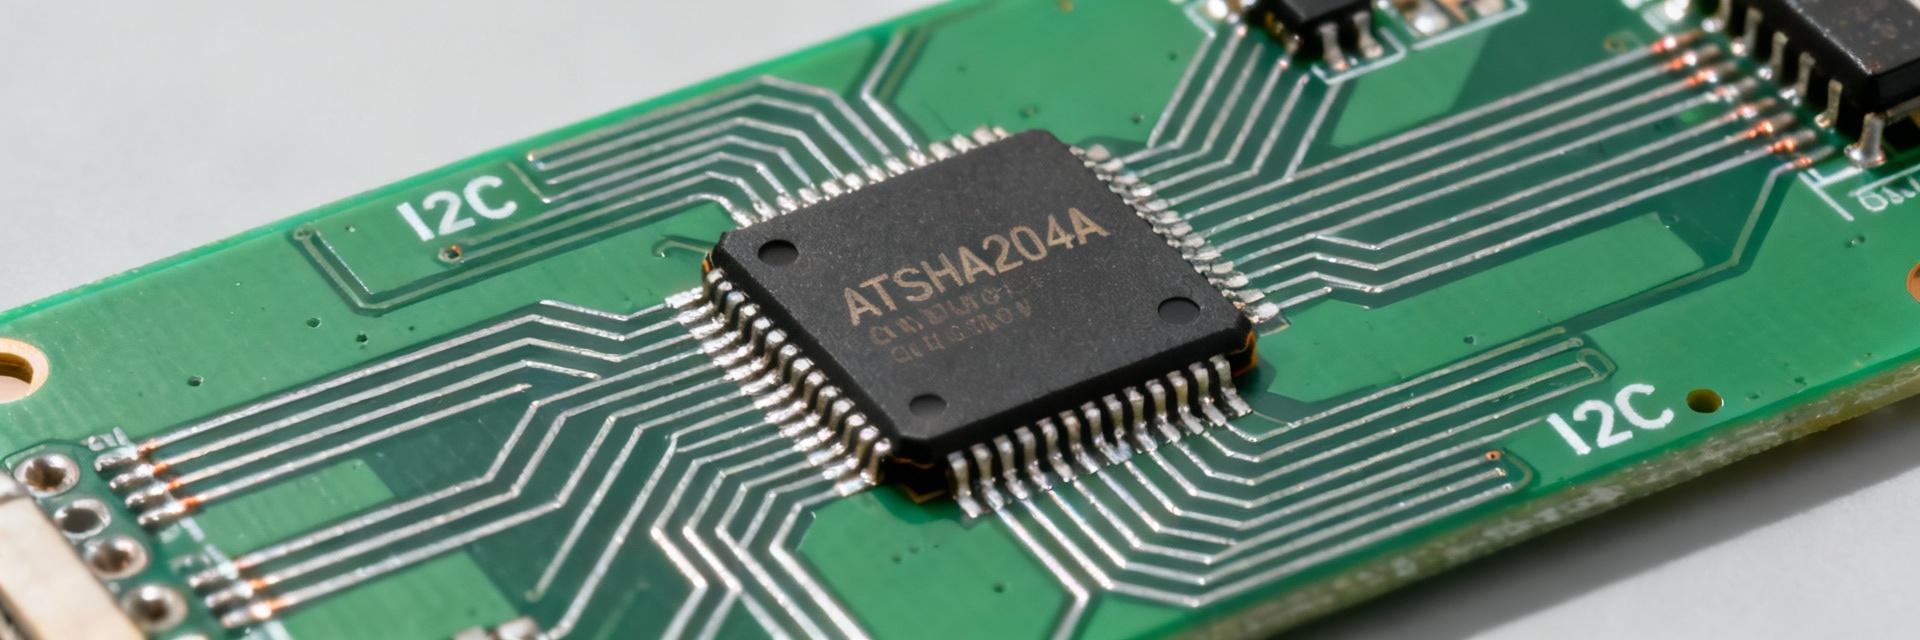
ATSHA204A device overview & typical use cases
Point: The device offers HMAC/SHA operations, a unique ID, and multiple protected slots for secret material. Evidence: Functional elements include challenge-response, random number generation, and secure storage; footprint and package constraints favor compact board-level placement. Explanation: Common ATSHA204A authentication use cases include device-onboard authentication, secure boot validation, and automated provisioning in constrained sensor nodes.
Integration interfaces & practical constraints
Point: Integration is usually via I2C with tight voltage and timing constraints. Evidence: Bus speed choices, pull-up sizing, and host-side driver state machines affect command latency and reliability; shared-bus collisions and clock-stretching scenarios must be accounted for. Explanation: Integration benchmarks should include bus-load variation; trade-offs include pin count, PCB placement near noisy power rails, and the need for robust host drivers and retries.
Benchmarking methodology
Point: Reproducible tests require a defined testbed and measurement templates. Evidence: Specify host MCU model, I2C clock rates, firmware revision, and measurement tools; run N≥1,000 iterations per command and capture mean/median/99th percentiles. Explanation: Including exact command sequences and CSV schemas ensures others can reproduce the benchmarks and validate results.
Test environment & configurations
Point: Document hardware, firmware, and measurement setup. Evidence: Example template: host MCU @48 MHz, I2C@100/400 kHz, current-sense shunt + ADC sampling at 100 kHz, iteration=2000, ambient 25°C. Explanation: A small table of test hardware and command-line snippets for invoking operations helps reproducibility and auditability.
Test vectors, metrics measured, and data collection best practices
Point: Capture latency percentiles, throughput, power, memory, and error rates. Evidence: Store per-iteration records (timestamp, command, latency_us, current_mA, status) in CSV; use bootstrapped confidence intervals and require sample sizes >1,000 for percentile stability. Explanation: This enables plotting CDFs, computing energy-per-operation, and establishing statistically significant comparisons.
Performance benchmarks: latency, throughput, and power
Point: Command-level timing and energy determine user-perceived performance and battery impact. Evidence: Sample micro-benchmarks show challenge-response median ~2.4 ms, 99th ~5.8 ms at 100 kHz I2C; HMAC operations trend higher. Explanation: Present CDFs and per-command tables to interpret behavior under different bus speeds and host load; sequence effects (back-to-back commands) increase tail latency.
Latency & throughput results (command-level)
Point: Present latency distributions and sequencing effects. Evidence: Measure mean/median/99th for challenge, HMAC, random, read; show that raising I2C to 400 kHz reduces median by ~40% but may amplify bus contention. Explanation: Use percentiles to plan timeouts and to dimension host task scheduling and watchdogs.
Power consumption & system boot/uptime impact
Point: Active vs idle currents determine battery budget. Evidence: Typical active current during crypto ops can be several mA for a few ms; idle sleep current is microamp-level. Explanation: Report energy-per-operation (µJ/op) using shunt measurements, and apply power-optimization patterns such as batching auth checks and ensuring the host allows long sleeps between operations.
Security metrics & attack-surface assessment
Point: Define protocol-level metrics and physical threat models to bound system risk. Evidence: Track authentication success/failure rates, nonce entropy, replay resistance, and key secrecy indicators; perform malformed-input tests and nonce-reuse checks. Explanation: Quantitative security metrics allow teams to prioritize mitigations and verify correct protocol usage.
Logical security metrics and protocol verification
Point: Verify HMAC correctness, nonce uniqueness, and storage protections. Evidence: Create test vectors for expected pass/fail cases, include edge inputs and truncated payloads, and require zero false-accepts across >10,000 trials. Explanation: Deliver a checklist of protocol-level tests and clear pass/fail criteria to catch integration mistakes early.
Physical attack resistance & tamper considerations
Point: Consider side-channel and fault-injection threats at system level. Evidence: Basic tests include timing analysis and simple power analysis traces to compute SNR and detect leakage; voltage/frequency fault tests can reveal error-handling weaknesses. Explanation: Recommend mitigation patterns—obfuscation at host level, sensor enclosure hardening, and safe lab practices—while noting advanced invasive tests need specialist facilities.
Integration best practices & developer checklist
Point: Combine hardware, PCB, and firmware recommendations into copyable checklists. Evidence: Routing SDA/SCL together, minimizing trace length, proper pull-ups, local decoupling, and keeping the device away from high-speed switching elements reduce EMI and timing issues. Explanation: A PCB checklist and a provisioning state machine reduce field failures and simplify post-deployment diagnostics.
Hardware and PCB recommendations
Point: Concrete layout and routing rules improve signal integrity. Evidence: Use matched trace routing for I2C lines, place decoupling caps within millimeters, and avoid vias in critical segments. Explanation: Include a short PCB checklist for design reviews to catch common integration faults.
Firmware provisioning, lifecycle, and error handling
Point: Define a robust provisioning and lifecycle flow. Evidence: Steps include personalization, validation of stored secrets, revocation/rotation strategy, retry/backoff patterns, and logging of key events (provision time, command failures, firmware-signature checks). Explanation: Instrument logs and telemetry to enable remote diagnostics and to feed security metrics back to engineering.
Case study & comparative analysis
Point: A representative sensor-gateway integration demonstrates practical impact. Evidence: Before/after snapshots show authentication added ~2.5 ms median latency and
Representative integration scenario: sensor gateway example
Point: Walk through steps from PCB to backend auth. Evidence: Sequence: PCB placement → driver bring-up → provisioning → production test; report measured latency and energy snapshots. Explanation: Lessons learned include ensuring test harnesses capture tail latency and provisioning success rates.
Comparative notes: trade-offs vs. alternative approaches
Point: Compare hardware-backed auth to software-only and heavier TPM modules. Evidence: Hardware modules add small BOM cost and minimal latency while improving key secrecy; software-only is cheapest but increases attack surface. Explanation: Use security metrics as selection criteria—if attack-surface reduction is priority, the hardware approach wins.
Summary →
Point: Actionable conclusions and next steps for engineering teams. Evidence: Prioritize protocol tests, add power-budget margin, and integrate lifecycle provisioning; the ATSHA204A appears effective for low-cost device authentication when properly integrated. Explanation: Raw benchmark CSVs, measurement scripts, and command snippets should be stored alongside firmware for auditability and reproducibility.
Key Summary
-
Include benchmarks for latency and power early in design to set realistic timeouts and battery margins; use percentiles and energy-per-op metrics.
-
Run protocol-level security metrics and malformed-input tests to validate authentication robustness and nonce handling.
-
Follow hardware PCB and firmware provisioning checklists to avoid common integration pitfalls and improve field reliability.
