This report synthesizes datasheet parameters, published test curves and bench measurements to give engineers a practical read on LM334Z behavior across voltage, load and temperature. The goal is to translate raw specs into actionable design guidance and operational performance metrics so US product and test engineers can make predictable choices when specifying currents and headroom.
The analysis focuses on measurable outcomes rather than marketing claims: capture absolute and recommended limits, quantify accuracy and temperature coefficient, and present test methods for line/load regulation, noise and drift so results map directly to design margins and verification plans.
1 — Background: What the LM334Z is and how it works
1.1 Device overview & core features
Point: The LM334Z is a three‑terminal adjustable current source used for biasing and reference currents. Evidence: Datasheets categorize it as a compact current source intended for µA to mA class currents. Explanation: Designers pick it for simple RSET-based setpoint control, small PCB footprint and ability to float, making it suitable for bias networks, sensors and test fixtures.
1.2 Electrical principle: ISET, RSET relation and floating behavior
Point: The device sets output current via an internal reference that translates to ISET≈K/RSET. Evidence: Bench curves show near-inverse proportionality between RSET and output current with deviations from ideal due to bias currents and compliance limits. Explanation: Expect to express the relation as IOUT ≈ VREF/RSET, then add small correction terms for bias and temperature when calculating expected current.
2 — Key specs breakdown (how to read the datasheet)
2.1 Absolute and recommended operating limits (V, I, T)
Point: Capture all numeric operating windows and design with safety margins. Evidence: Datasheet tables list supply/compliance voltage, minimum/maximum set currents, temperature rating and power dissipation. Explanation: Record these fields in a concise table to drive headroom and derating decisions during schematic and thermal design.
| Parameter | Typical Range / Unit | Notes |
|---|---|---|
| Compliance / Input Voltage | ≈1.2 V to 40 V | Require headroom above VREF; verify at target IOUT |
| Settable Current | ≈1 µA to 10 mA | Use RSET to span range; watch RSET power |
| Operating Temperature | Device grade dependent, e.g., 0 °C to 70 °C | Choose grade that matches application |
| Power Dissipation | Based on (Vin−Vout)×Iout, W | Derate for PCB thermal limits |
2.2 Accuracy, temperature coefficient and stability specs
Point: Translate percent/tc figures into absolute current deviations for the design target. Evidence: Datasheet lists initial tolerance and tempco in % and µA/°C equivalence. Explanation: Example: for a 100 µA target and 1% initial tolerance, expect ±1 µA; a 200 ppm/°C tempco yields ±0.02 µA/°C—convert these to cumulative drift over expected ΔT to set margins.
3 — Performance metrics & test methodology
3.1 What to measure: line regulation, load regulation, dynamic response, noise, drift
Point: Define a compact set of performance metrics to report. Evidence: Typical reports show Iout vs Vin (line), Iout vs Load (load), transient steps, noise PSD and long-term drift plots. Explanation: Each metric answers a design question—line regulation quantifies headroom sensitivity; load regulation shows current stability under changing sinks; noise and drift quantify error sources in sensing circuits.
3.2 Recommended test setups & measurement best practices
Point: Use controlled conditions and instrumentation matched to the metric. Evidence: Bench setups that sweep Vin slowly, use calibrated low‑noise sources and high-resolution meters produce repeatable curves. Explanation: Measure at RSET values that exercise min/nom/max currents, use compliance voltages above worst-case Vdrop, thermally isolate device, and employ averaging to reduce instrument noise floor.
4 — Bench test results: typical curves and how to interpret them
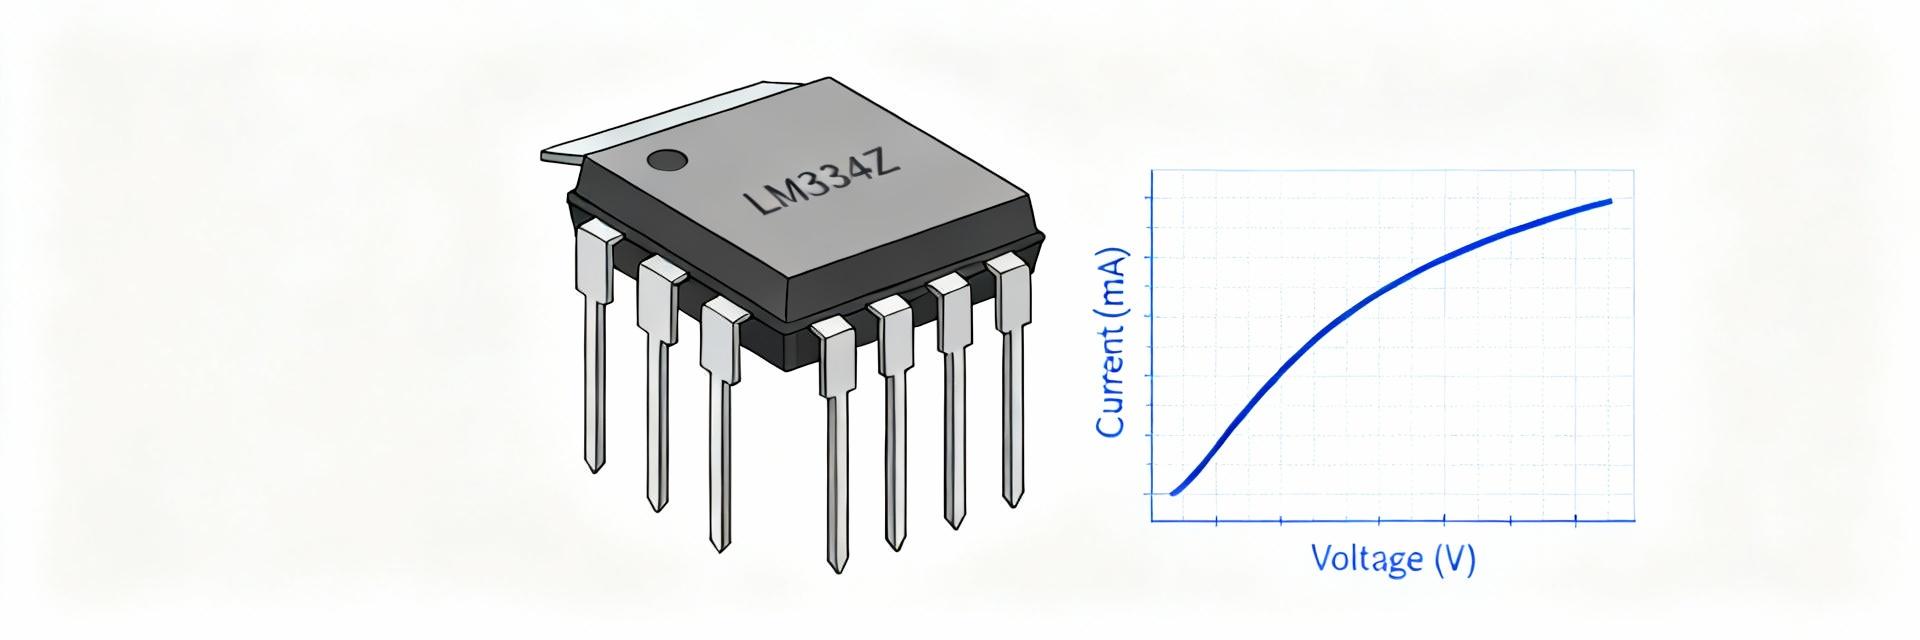
4.1 Key plots to include and what they reveal
Point: Mandate a short list of publication plots for clarity. Evidence: Iout vs Vin, Iout vs RSET, Iout vs Temperature, transient response and noise spectrum reveal distinct failure modes. Explanation: A flat Iout vs Vin across expected Vin range shows healthy compliance; temperature slope reveals tempco; a slow transient or overshoot points to compensation or layout issues.
4.2 Diagnosing deviations from datasheet
Point: Follow a checklist when measured data diverges. Evidence: Common root causes include wiring resistance, thermal coupling and instrument limits. Explanation: Verify connections, measure RSET tolerance, reduce thermal gradients, confirm compliance voltage and check multiple units to separate lot variation from measurement artifacts; quantify discrepancies in absolute µA and percent terms.
5 — Application & design guidelines
5.1 Typical circuit uses and topology examples
Point: Match device strengths to common topologies. Evidence: The LM334Z is often used for constant bias, temp‑dependent references and lab current sources. Explanation: Select RSET by target I = VREF/RSET (with corrections), ensure sufficient headroom across the load, and place current sense or shunt resistors where they do not inject thermal error into the device.
5.2 Layout, thermal and protection considerations
Point: PCB and thermal design strongly affect stability. Evidence: Thermal coupling to power traces or hot components shifts Iout; high (Vin−Vout)×Iout increases dissipation. Explanation: Keep the device away from hot components, provide thermal relief and vias under heat‑dissipating areas, add series protection for reverse voltages and use decoupling to limit transient disturbances.
6 — Troubleshooting & optimization checklist (actionable)
6.1 Common failure modes and fixes
Point: Have an ordered set of quick checks for faults. Evidence: Frequent issues are excess drift, unstable output or wrong set current due to RSET tolerance or wiring. Explanation: Immediate fixes: confirm RSET value and tolerance, reflow suspect joints, isolate thermal sources, verify compliance voltage and swap units to rule out part defects.
6.2 Pre-release optimization and test checklist
Point: Run prioritized verification before product sign-off. Evidence: Functional test, thermal soak, EMC influence and batch sampling catch most issues. Explanation: Recommended pass/fail thresholds: line and load regulation within specified percent of set point, noise below application budget, and batch unit spread within quoted tolerance to approve production.
Summary
- Capture absolute and recommended operating specs (voltage, settable current, temperature, dissipation) to define headroom and derating; use the table to extract numeric limits and safety margins for design and verification, validating against the datasheet.
- Prioritize the short performance metrics set—line regulation, load regulation, transient response, noise and drift—and measure each with controlled test setups to translate specs into application-level expectations for current stability.
- Apply layout and thermal rules: isolate the device from heat sources, ensure adequate thermal vias and derating for (Vin−Vout)×Iout, and confirm RSET accuracy; these actions reduce drift and ensure predictable LM334Z behavior in end systems.
Frequently Asked Questions
How should LM334Z RSET be chosen for a target current?
Choose RSET by rearranging the device relation I ≈ VREF/RSET, then add correction for initial tolerance and tempco. Evidence from bench work: pick RSET for nominal I, then choose a tighter resistor tolerance or trimming to meet final specs. Verify across temperature and supply variation during validation.
What test conditions expose thermal sensitivity for LM334Z?
Thermal sensitivity appears when (Vin−Vout)×Iout causes device heating or when nearby components heat the package. Evidence: Iout vs temperature sweeps and thermal soak tests reveal drift. Mitigate with PCB thermal relief, spacing and thermal vias, and quantify drift in µA/°C for the application budget.
Which performance metrics should trigger a redesign decision?
If line or load regulation exceeds the allowed percent error, noise degrades sensing, or batch variation violates tolerance, those metrics should prompt redesign. Evidence: Compare measured values to application error budget; if margins are tight, adjust RSET approach, add buffering stages or change thermal/PCB strategy before final release.
